Mapping data to graphics
Getting started
You’ll be doing all your R work in R Markdown this time (and from now on). You should use an RStudio Project to keep your files well organized (either on your computer or on RStudio.cloud). Either create a new project for this exercise only, or make a project for all your work in this class.
You’ll need to download three CSV files and put them somewhere on your computer or upload them to RStudio.cloud—preferably in a folder named data in your project folder:
To help you, I’ve created a skeleton R Markdown file with a template for this exercise. Download that here and include it in your project:
In the end, the structure of your project directory should look something like this:
your-project-name\
  03-exercise.Rmd
  your-project-name.Rproj
  data\
    The_Fellowship_Of_The_Ring.csv
    The_Two_Towers.csv
    The_Return_Of_The_King.csv
To check that you put everything in the right places, you can download and unzip this file, which contains everything in the correct structure:
Task 1: Reflection
Write your reflection for the day’s readings.
Task 2: Lord of the Rings
Answer the following questions:
-
Use
group_by()andsummarize()on thelotrdata to find the total number of words spoken by race. Don’t worry about plotting it. How many words did male hobbits say in the movies? -
Use
group_by()andsummarize()to answer these questions with bar plots (geom_col())-
Does a certain race dominate the entire trilogy? (hint: group by
Race) -
Does a certain gender dominate a movie? (lolz of course it does, but still, graph it) (Hint: group by both
GenderandFilm.) Experiment with filling byGenderorFilmand faceting byGenderorFilm. -
Does the dominant race differ across the three movies? (Hint: group by both
RaceandFilm.) Experiment with filling byRaceorFilmand faceting byRaceorFilm.
-
-
Create a plot that visualizes the number of words spoken by race, gender, and film simultaneously. Use the complete tidy
lotrdata frame. You don’t need to create a new summarized dataset (withgroup_by(Race, Gender, Film)) because the original data already has a row for each of those (you could make a summarized dataset, but it would be identical to the full version).You need to show
Race,Gender, andFilmat the same time, but you only have two possible aesthetics (xandfill), so you’ll also need to facet by the third. Play around with different combinations (e.g. tryx = Race, thenx = Film) until you find one that tells the clearest story. For fun, add alabs()layer to add a title and subtitle and caption.
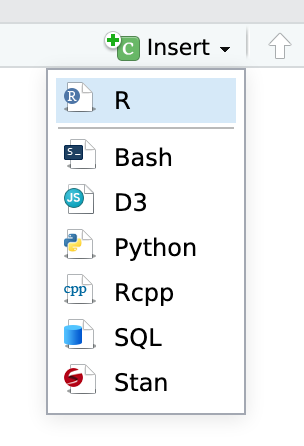
You’ll need to insert your own code chunks where needed. Rather than typing them by hand (that’s tedious and you might miscount the number of backticks!), use the “Insert” button at the top of the editing window, or type ctrl + alt + i on Windows, or ⌘ + ⌥ + i on macOS.
Turning everything in
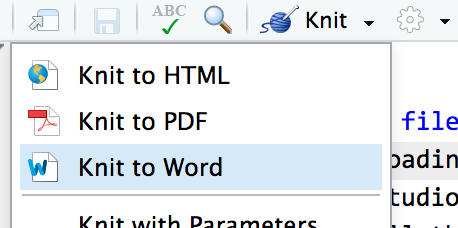
When you’re all done, click on the “Knit” button at the top of the editing window and create an HTML or Word version (or PDF if you’ve installed tinytex) of your document. Upload that file to iCollege.